Saturday, February 28, 2009

Market Capitalization

There is an old idea on Wall Street that any sustained rallies must see participation from the financials. I have heard this idea thrown around a lot recently and it got me thinking. I know that from a fundamental standpoint, the financials need to stop falling. The financials are main cause of the current recession and for our economy to recover credit needs to start flowing. Banks need to stop failing and confidence needs to return to the sector.

With that said, I disagree that financials need to participate for the market to rally...somewhat. The financials have always been an important part of the market simply by the fact that they were a big part of the market. That is not the case anymore. Everyone knows the financials have fallen the hardest, so I decided to take a look at the data. Below are the market caps of the S&P 500, broken down by sector. As you can see the financials just aren't what they once were.


I'm not tying to say that the financials don't matter anymore, because they do. They simply don't "count" as much as they used to. Their market cap is half what it was a few years ago, so they are going to have half the effect on the S&P 500. I haven't taken a look at any broader indices, but I'm guessing the picture would be the same.

I think it's plausible that we could get a rally in the market while the financials lag. Even if they stay neutral, we could have have the other 90% of the market rallying. I'm not predicting we will be getting a rally anytime soon, but simply our market structure is much different than it was even a few years ago.

Friday, February 27, 2009

Dow: No Growth

Here's an interesting chart of the Dow. There has been a lot of talk about how the market has gone nowhere in the past decade. We have seen this in the past, most recently in the 70's. That decade yielded absolutely nothing if you bought and hold. What is interesting is that after about 16 years of going nowhere, we essentially had an 18 year bull market moving the Dow from 1,000 to over 11,000. After the "small" little tech bubble crash, we proceeded to move to 14,000. We're now back in the seven thousands and looking for a bottom. This long term chart just puts things in perspective.

Regional Banks

I'm watching the Regional Bank ETF (IAT) for a short opportunity. I'm looking for a rally towards resistance or a breakdown below support.

Regional Banks (IAT)

Thursday, February 26, 2009

Still Waiting for a Bounce

We are still very oversold at this point. The only group that has rallied over the past few days is the financials. If we fail to stage even a small rally in the broad averages it would be a very negative sign for the markets.

S&P 500

Wednesday, February 25, 2009

SXCI: Position Trade

I like SXCI here as a position trade. It had a nice breakout late last year, and has pulled back to trendline support. SXCI also has relative strength and volume to confirm the move. I'm trying to bid around $19.50 for an initial position. If I can't get hit I'll probably up my bid because I really like the chart on this thing.

SXC Health Solutions Corp (SXCI)

Gold Pulling Back

As equities rallied yesterday Gold fell about 2.5%. I'm waiting for Gold to enter my "buy zone" before I consider a long position. I think Gold below $835 would offer an attractive entry point. I am also keeping an eye on the GDX (Gold Miner ETF) for a similar entry.

Gold
Gold Miners (GDX)

Monday, February 23, 2009

Looking for a Bounce

I think that we are probably going to get a small bounce within the next week. I'm thinking we made get a short little run towards 800, at which point I think we will continue downward. The McClellan Oscillator is getting to an area where it has bounced recently, and the % of stocks above their 50 DMA is also nearing low levels. Long and Intermediate trends are down, but I would rather wait for a bounce before shorting.

S&P 500

Crude Oil

Here is an interesting level in crude. The $38 level, which acted as support earlier this decade, now is a long term level of support. It tried to penetrate this level for a couple of days, but it was not able to hold. Looking at a shorter term chart Crude looks like it could continue lower. I see a descending triangle, which could easily breakout to the downside. I would like crude oil to sit here above the $38 level for a little while. The longer it stays above $38 the more confidence I will have the the lows have been put in. If crude is able to hold I would look into Oil Producers and Oil Service companies.

Weekly

Daily

Sunday, February 22, 2009

QQQQ Performance

This was called out by another blog (Cobra's Market View I believe) a week or so ago. I plotted the QQQQ's performance against the SPY. Behind that is the performance of the Nasdaq 100 itself. After large spikes of outperformance we have seen major moves down in the index. This is something I will be keeping an eye on.

Saturday, February 21, 2009

OIS "Bottom Picking"

I don't usually try to pick bottoms, but here is an interesting play. The divergence in OBV first drew my attention, and the Accumulation Distribution also confirms OBV (I just didn't include it in the chart). I also think the Oil Service Industry in general may be nearing a bottom. The same OBV divergence exists in the OIH. Also, the Oil Service names have been flat while Crude Oil declines, showing another positive divergence.

Oil States International (OIS)
Oil Service HOLDRS (OIH)

Market Preview 2/23

Last week the market gave us plenty of reasons to be bearish. At the same time there are breadth issues that keep me from being overly bearish. In my post a couple of days ago I noted that there are several sectors that are well off their November lows. When the market made lows in November, every sector was either at or very close to a 52 week low. This is not the case right now. Another breadth issue is with the NYSE Advance/Decline line. While the Dow is at and the S&P is close to new lows, the A/D line is holding above it's November low. Below is a chart of the S&P, with the NYSE A/D line in the lower part of the chart.


Below is a chart of the Nasdaq 100. It has been the best of the major indices over the past few months. Investors have fled to Tech recently as a safe haven, but if the QQQQ's breakdown, then I think we'll get a big move down in the broader indices.


The Dow has been leading the rest of the indices down over the past week. It seems the most vulnerable to a complete breakdown.

The Financials have and continue to drag the market down. They have been trading on news way to much lately for me to be comfortable taking a position in them. Treasury Secretary Geithner is supposed to reveal more on his housing plan early next week. Depending on what details (or lack of details) he gives could determine where the financials and the rest of the market goes from here.


Two other Industries that are concerning are the Industrials (XLI) and Consumer Staples (XLP). Both of these Industries are making new lows and are also leading the market down.

Industrials (XLI)

Consumer Staples (XLP)

The Energy (XLE), Materials (XLB), Utilities (XLU), and Consumer Discretionary (XLY) Sectors are also heading lower, but are still holding above their November lows. Watching this group could give us insight into what the broader market will do. If these names bounce off of lows, we could see a bounce in the rest of the market. If they breakdown, we will probably see another round of selling.

Energy (XLE)

Materials (XLB)

Utilities (XLU)

Consumer Discretionary (XLY)

The two sectors that continue to hold up the best are Healthcare (XLV) and Technology (XLK). If the broader market holds around it's November lows, these two sectors could try to lead the market higher.

Healthcare (XLV)

Technology (XLK)

The market seems to be split between the good sectors, the bad, and the mediocre. Tech and Healthcare are showing some good signs, but with the broader showing weakness, the bias has to be to the downside. Even though my bias is short, I wouldn't be surprised to get a small little rally back towards prior support. On the short side, I would look to the Financials, Industrials, and Staples. The key in this market is to be quick. Don't get married to one side or the other, because the market can turn on a dime.

Friday, February 20, 2009

SPX

As the S&P tests November lows, the A/D line continues to hold above it's low.

SMH Strong

Technology showed relative strength today. One of the better groups was the Semiconductors. If we can hold lows in the broader market, i'll be looking to some of the names within this industry.

Thursday, February 19, 2009

Breadth

I'm not seeing the breadth to the downside that we saw last time we tested 7450 in the Dow. Below is an overview of the Sectors and the % off their 52 week lows. It compares what we saw on November 21st and what we are seeing now. I'm not trying to call a bottom here, but it's something to keep in mind.

Above 50 DMA

The percentage of stocks above their 50 DMA can be a good leading indicator. During Bull Markets, a move up from very low readings signal the correction is nearing an end. During a Bear Market, moves down from very high reading signal overbought areas and signal the decline is about to resume. Below is a 5 year chart of the S&P 500 to demonstrate this indicator.

Copper

Copper is showing some positive signs, so I thought I'd dig into it a little more. I also highlighted FCX, which would benefit from Copper recovering.


Here's a company who would benefit from rising copper prices.


Obviously I'm not going to jump in here because it's to early, but it's always good to keep an eye on commodities. They are usually good leading indicators for the economy.

Biotech

Biotech has bee one of the outperformers lately. If we can hold the November lows in the Dow then I'll be looking at this Industry.


I found THRX, which may work.

I was in GILD on Wednesday but got shaken out when it looked like the market might break down. I should have stayed in, and I won't hesitate to re-enter if it looks like we can hold the lows.

Wednesday, February 18, 2009

LT DJIA

Here's a chart of the Dow using the same study I used the the last post. The orange line is the difference between the 34 and 13 EMAs, relative to it's 34 EMA (The line is in ratio form to account for the difference in price over time). When the line goes up, it means price has declined quickly. The highest level ever was in 1932 at .27. The .12 we saw at the end of last year was the highest level since then. This just shows us how large and how quick the sell off really was in comparison to the past.

Dow Jones Industrial Average

LT Chart

Heres an interesting long term chart of the S&P dating back to 1987. Plotted below in orange is the difference between the 34 and 13 exponential moving averages on the weekly timeframe. It spiked late last year to it's highest level as far as my charts go back (1960's). Just thought it was interesting.

Lessons Learned

I though I'd review market action from the past couple of weeks. Hopefully we can gain some insights as to what we did right and what we did wrong.

S&P 500

Long XLV Short DIA

I put on a hedge today. As i've seen stating I think health care is going to outperform. I am a bit worried however that we may breakdown to new lows. If we do break down the Dow is going to lead us there.

XLV
DIA

Tuesday, February 17, 2009

HUM

I'm looking to bid some more of the health care names assuming the S&P holds it's November lows. If we do break those lows with conviction i'll have to bail out.

Alaska Air

ALK continues to outperform both the S&P and the Airline Index. On a down day it was actually up 3%. I have ben long the Airlines for a while now and it has been working nicely. ALK looks good for a position trade. Trading above 50 and 150 DMA's and as I stated before showing good relative strength.

Ugly Day

Precious metals and Health care continue to show relative strength.

ANR

Heres an interesting metals play. Industry group is getting hot. OBV is increasing and this would be a nice breakout play.

Alpha Natural Resources

Monday, February 16, 2009

Suncor Energy

In my last post I analyzed the Exploration and Production Industry ETF (XOP). Heres a company within that industry that I will be keeping my eye on.

Suncor Energy (SU)

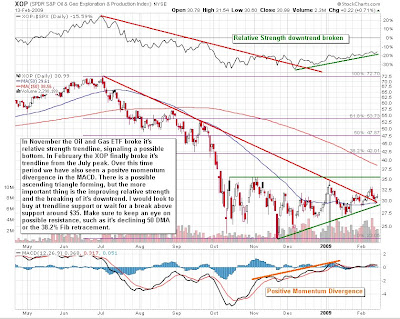
XOP: Oil and Gas

The Energy Sector has started to show signs of a bottom, so I gave the XOP a look. In the chart below I point out a couple of positive signs we are seeing in the ETF.

Watching for Entry in Silver

I've been watching Silver lately, looking for a place to go long. In the chart below, you can see that we are approaching resistance around $14. I would wait for a pullback from that $14 level that we might get. If we do go straight through $14, then I'd look for a pullback to that level. Either way you don't want to chase it here.

Sector Overview

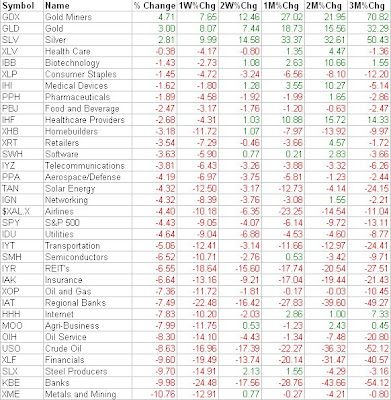
I thought I'd take a look at some of the sectors out there. I'll start out with the ugly, work my way up to the ugly and finish off with the good.

First we have the Financials, via the XLF. Below is a weekly chart. I would initially look to short on rallies up to the declining 50 day moving average. On any breaks above that I would still probably be looking to short at some level of prior resistance, but of course I would have to evaluate the situation before making any trades.

Next we have Consumer Staples. The XLP and the XLF are lead the pack on the downside.


After Financials and Staples we have a few groups that are closer to neutral. This group includes Consumer Discretionary (XLY), Industrials (XLI) and Materials (XLB). These groups do have some positive signs, but are not all that far from breaking to the downside.


OK so we got the bad groups out of the way. Now on to some brighter spots.

First I'll start with Energy. The XLE has made moves similar to the previous three ETF's, but it has held above it's January lows fairly well. Also, note the relative strength versus the S&P.


After that we have technology. The XLK, much like the QQQQ's, have turned a corner over the past couple of months. We have seen improvement in this group and it looks as if it wants to hold it's trendline.


Lastly we have Healthcare. As you can see the XLV has been outperforming the broader market since early 2008. It is one group that actually broke it's "wedge formation" to the upside. It then retreated back into it's range but then quickly regained steam.


The one group I did not include was the Utilities (XLU). I didn't cover it because it has basically flat lined over the past few months. It has made similar moves to the SPY, it just has done if with less volatility. In other words, I think it's kind of boring.

I also want to make the point that there are some good Industries within these Sectors. Within Healthcare, Biotechnology and Health Care providers are doing well. In Tech, Internet and Software names are outperforming. I think it's important to make sure you are in the right Industries, and analyzing the Sectors gives us a broader sense of where the strength is.